

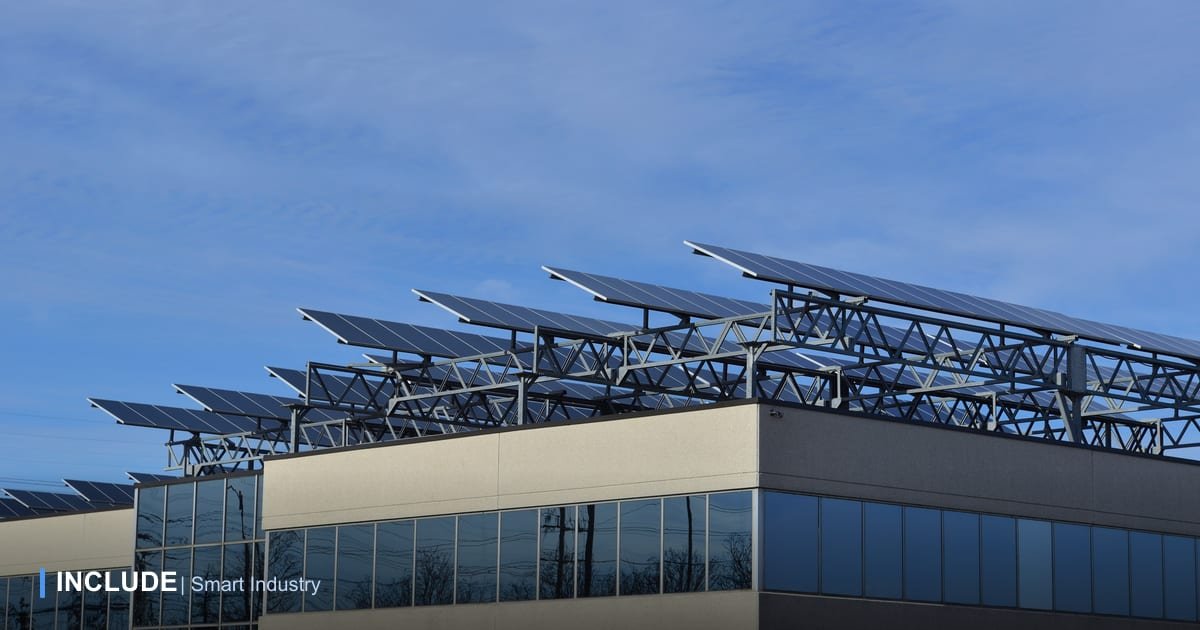
Many plants install rooftop solar with one expectation: a lower electricity bill. Once the panels are up and the inverter is running, nobody usually checks whether the system performs as planned. Rooftop solar monitoring often stops at the inverter's own app, opened now and then, separate from the plant's consumption data.
Yet two questions decide whether a solar investment actually pays back: how much electricity is produced, and how much is actually used on site. This article covers why the second question now matters far more, and which metrics to track.
New rules make self-consumption the key
Since Minister of Energy and Mineral Resources Regulation No. 2 of 2024 on rooftop solar took effect, excess electricity that rooftop solar exports to the PLN grid no longer counts against the bill. In other words, solar power only has value if the plant's loads use it at the moment it is produced.
The consequences are practical. System capacity should match daytime load, and loads that can be shifted (such as pumps, charging, or certain processes) are best run when solar output is high. Decisions like these can only be made when solar production and plant consumption are visible side by side.
Metrics you need to track
- Daily production (kWh). The baseline. Compare day to day and month to month to see the trend.
- Specific yield (kWh/kWp). Production divided by installed capacity. It lets systems of different sizes be compared, including roofs across one site.
- Performance ratio (PR). Actual output against theoretical output from the irradiance the panels actually received. PR separates "it was cloudy today" from "the system has a problem".
- Self-consumption ratio. The share of solar output used directly by plant loads. Under the new rules, this is the number that decides your savings.
- Inverter downtime. An inverter that trips and does not restart can lose days of production unnoticed.
Problems you only catch with data
- Dust and dirt. In industrial areas, panel surfaces soil quickly. A slow but steady fall in PR is often the sign that cleaning should be brought forward.
- New shading. Pipes, stacks, or new structures can shade part of the array at certain hours. It shows up as a production dip at the same time every day.
- Failed strings or panels. One dead string cuts output permanently, yet on a sunny day the total still looks "fine".
- Falling daytime load. If production schedules change and daytime load drops, unused solar power is simply wasted. The inverter app will not show this.
Irradiance: the comparison people forget
Without irradiance data, it is hard to tell bad weather from a fault. Most of Indonesia receives around 4 to 5 peak sun hours a day, but daily values swing widely in the rainy season. An on-site irradiance sensor gives a fair baseline: if irradiance is normal but output drops, the problem is in the system, not the sky.
Combining solar and plant consumption data
Monitoring delivers the most value when solar production, irradiance, and per-panel consumption sit on one dashboard. You can then see at what hours the plant still draws PLN power while solar output is high, which loads are worth shifting to daytime, and what the real monthly savings are.
The same data helps plan load around PLN peak hours, covered in cutting electricity cost during WBP peak hours, and feeds a data-driven energy audit.
Building a monthly solar report
A useful monthly report does not have to be long. It only needs to answer four things, all of which can be built from automatically recorded data:
- Output against projection. The contractor's projection at installation is the starting reference. A gap that keeps widening month after month needs investigating.
- Real savings. Calculate them from solar power used on site multiplied by your PLN tariff, not from total production. Under the current rules, this is the only figure that reduces the bill.
- Fault events. How many times the inverter tripped, for how long, and how many kWh were lost as a result.
- Next month's actions. Cleaning schedules, string checks, or loads to move into daytime hours.
A report like this also makes conversations with the O&M contractor easier. A complaint backed by daily production and irradiance data gets acted on far faster than "it feels like output has dropped".
How INCLUDE monitors rooftop solar
InEnergy has a dedicated view for solar and three-phase distribution, alongside plant consumption data. The IncludeBox Solar Meter measures solar voltage, current, and power, while the IncludeBox Weather Station records irradiance as the baseline. If an inverter or power meter is already installed and speaks Modbus, its data can come in through IncludeGateways without replacing hardware.
Rooftop solar installed, but the savings are unclear?
Tell us the system capacity and inverter type. The INCLUDE team will help assess measurement points for InEnergy.
Free consultation on WhatsApp → See InEnergy →