

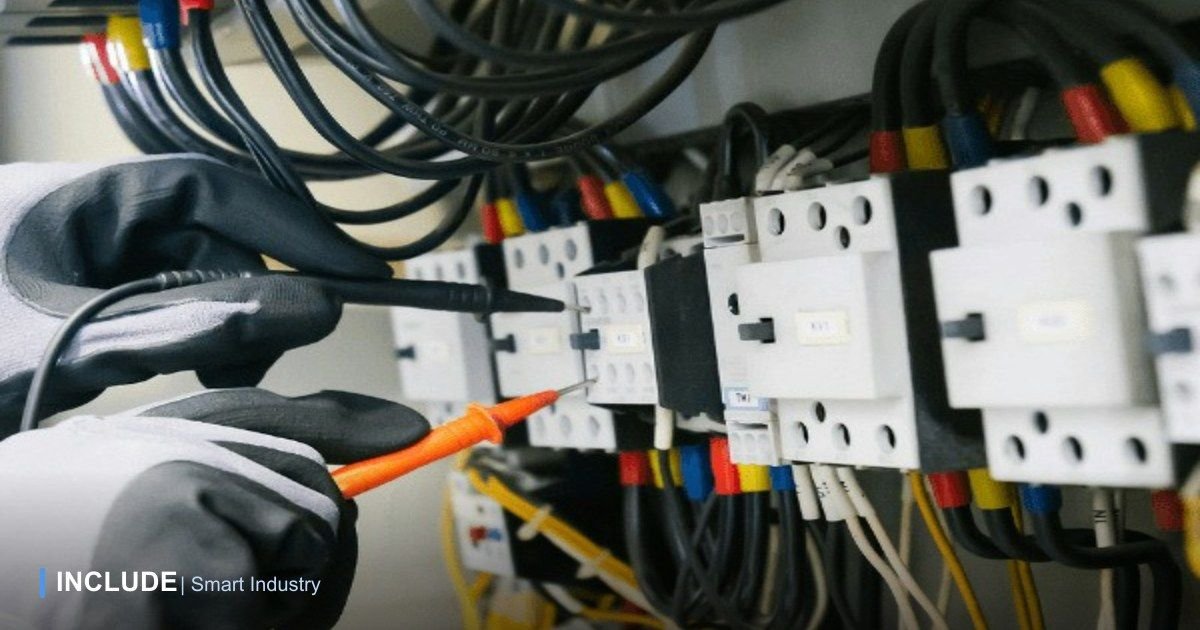
Energy audits are usually run as a standalone project: an external team arrives, installs portable power meters for a few days or weeks, gathers data, then produces a recommendation report. The process is legitimate and still valuable for an initial comprehensive audit, but it has a structural limitation, the resulting report is a snapshot of one time period, and once operating conditions change (new machines added, shift schedules shifted, equipment replaced), the data is already stale. The next audit only happens a year later, or not at all.
Why a one-time audit isn't enough
- Consumption patterns shift throughout the year. An audit run during a low-production month paints a different picture than a high-load month, one snapshot doesn't represent the real pattern.
- Recommendations are hard to verify. After an audit recommendation is implemented (e.g. swapping in a more efficient motor), there's no easy way to verify the actual savings without continuous consumption data to compare before and after.
- New waste goes undetected until the next audit. A machine starting to run inefficiently due to wear, or a new energy-wasteful operational habit, is only discovered at the next audit, which could be a year away.
From power meters to an always-current report
A real-time data approach turns auditing from a one-off project into an ongoing capability. The flow:
- Sub-metering per line or area. Power meters installed permanently per production line or area, not a single measurement point at the main panel, this is what makes it possible to know where consumption happens, not just the total.
- Continuously recorded data, not a snapshot. Consumption is recorded continuously, so hourly, daily, and seasonal patterns are all visible, including when peak load actually occurs.
- Automatic baselines to catch deviation. Once a normal per-line pattern forms from historical data, significant deviations (a machine starting to waste power, a compressed-air leak) can be caught early, rather than waiting for the annual audit.
- Efficiency reports assembled automatically. Instead of compiling a manual report from raw data, per-line consumption summaries, monthly trends, and cost projections can be generated directly from already-recorded data.
Metrics worth tracking beyond total kWh
Total energy consumption alone doesn't say much without context. More useful metrics for an efficiency report:
- Energy consumption per production unit (kWh/unit), reveals whether efficiency is improving or worsening independent of production volume swings.
- Peak vs off-peak load ratio: the portion of consumption falling in peak-load hours, which directly affects the electricity bill.
- Load factor: the ratio between average and peak consumption; a low value signals contracted power capacity isn't being used efficiently.
- Consumption outside operating hours. Load that stays high when the plant should be idle often signals equipment left running or a system leak (e.g. compressed air).
These metrics are most valuable compared across lines or across periods, not read as a single number. A line with kWh/unit far higher than a comparable line usually points to a specific problem (a machine needing maintenance, or inefficient operation) something a plant-wide total would never reveal on its own.
Setting up sub-metering: where to start
Installing power meters at every point at once is rarely realistic on budget or time. A more practical sequence:
- Start with the largest loads. Identify the 3-5 machines or lines contributing most to energy consumption (usually visible from existing transformer or main panel data) and sub-meter those first.
- Include the areas most suspected of waste. Compressed-air compressors and HVAC/cooling systems are often a hidden source of waste invisible from the main meter alone.
- Expand gradually based on results. Once a baseline from the initial points forms and starts showing meaningful patterns, expanding to other lines is easier to justify with real savings figures from the first phase.
How INCLUDE answers this need
InEnergy provides sub-metering and a real-time energy consumption dashboard on top of the INCLUDE platform, so energy audits no longer depend entirely on periodic external team visits. The same data used to monitor daily peak load (covered in our peak-load cost strategy) also becomes the basis for an always-current efficiency report, not a one-time snapshot that goes stale the moment plant conditions change.
When was your plant's last energy audit?
Tell us how many lines and power meters you already have. The INCLUDE team will help assess sub-metering readiness for InEnergy.
Free consultation on WhatsApp → See InEnergy →