

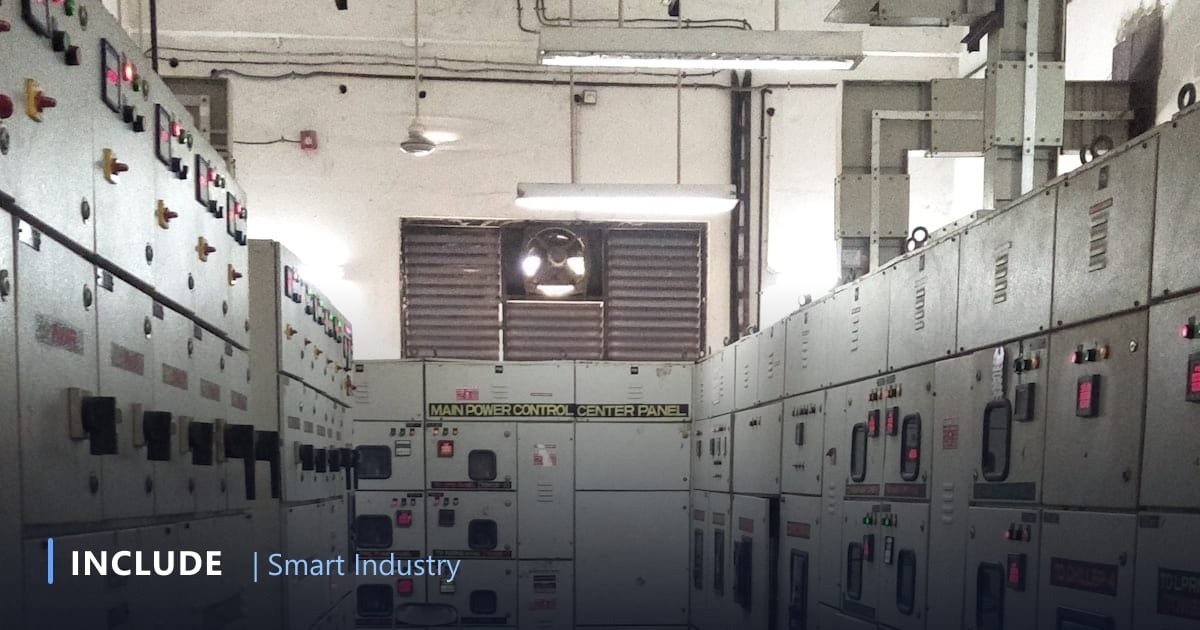
Many factories see their electricity bill climb 10-15% without any increase in production volume. The cause is rarely visible on the main meter: peak-hour demand spikes and a power factor that has drifted below 0.85, triggering reactive energy charges. As long as measurement happens once a month through a single meter, this cost cannot be traced, let alone fixed.
Three bill components that get overlooked
An industrial power bill is not simply "kWh times tariff". These three components quietly erode margin:
- Peak-hour consumption: energy used during peak-load hours is billed at a higher rate. Running compressors, ovens, or large chillers simultaneously in that window drives up the effective cost per kWh.
- Power factor (cos φ): induction motors, welding sets, and chillers draw reactive power. When power factor falls below the utility's threshold, excess kVArh charges appear: energy you pay for that produces no output at all.
- Oversized contracted capacity: a fixed demand charge is paid every month even if the capacity is never fully used. Without a load profile, there is no basis to renegotiate it.
All three share one requirement: interval data, not a monthly figure. You need to know what happens minute by minute, and on which line.
Why one main meter isn't enough
The main meter tells you how much you consumed, not who consumed it. When demand spikes at 2 p.m., that meter cannot answer the question that actually matters: was it the air compressor, the chiller, the oven: or all three starting at once?
That answer only comes from sub-metering: measurement at the panel, production line, or major machine level. Consumption then becomes actionable: kWh per line, kWh per shift, and (most useful to management) kWh per unit produced.
How InEnergy monitors energy per line
InEnergy is the energy monitoring platform in INCLUDE. The flow is simple and does not disturb production:
- Read from existing power meters. Most modern panel meters already expose an RS-485 port speaking Modbus RTU. Voltage, current, kW, kVAr, cos φ, and kWh can be read directly: no device replacement needed.
- Transport through a gateway. IncludeGateways polls the RS-485 line and forwards data to the platform over the plant network, 4G, or LoRa for points far from coverage.
- Present decisions, not raw numbers. The dashboard shows daily load profiles, line-by-line comparisons, power factor trends, and consumption per shift.
- Alert before the penalty. Notifications fire when demand approaches the contracted limit or power factor drops below threshold, ahead of the charge, not after the bill arrives.
What to do once the data exists
Energy data only pays off when it changes operational decisions. The most common actions after sub-metering goes live:
- Shift load out of peak hours. Processes not bound to production sequence (tank filling, pre-cooling, compressor charging) can often be rescheduled without affecting output.
- Avoid simultaneous starts. A simple interlock or a revised start-up SOP prevents several large loads from energising in the same minute.
- Correct power factor where it actually degrades. Per-panel cos φ data shows exactly which capacitor bank needs servicing or expansion, instead of guessing at plant level.
- Find off-hours consumption. Load that stays high overnight or on weekends almost always means equipment left running, compressed-air leaks, or a chiller working harder than it should.
- Charge energy back internally. When each line sees its own energy cost, efficiency stops being a poster on the wall and becomes a measurable responsibility.
Reading a single day's load profile
The daily load profile is the most informative document sub-metering produces, and reading it requires no engineering background. A few patterns show up almost every time:
- A high baseline. The lowest line on the chart (usually in the early hours) shows consumption while the plant is barely producing. If it sits at 30-40% of peak, equipment is running without producing anything. This is typically the first finding that yields immediate savings.
- A sharp spike at shift start. Several large loads energised together create a brief peak that sets the demand charge for the entire month. Restaggering start-up by a few minutes is often enough to cut it.
- Peaks landing in peak-tariff hours. When maximum consumption happens to fall inside the expensive window, the cost multiplies. Moving a single process out of that window can change the shape of the bill.
- Consumption that doesn't fall when production stops. If the line halts but the curve stays flat, supporting loads (compressors, chillers, exhaust fans) are probably never switched off with it.
- A gradual week-over-week rise. Slowly increasing consumption at constant output is the classic signature of degrading efficiency: clogged filters, compressed-air leaks, or heat exchangers due for cleaning.
What makes this chart valuable is that it converts debate into inspection. Instead of assuming the bill rose because tariffs rose, you can point to the day, the hour, and the line responsible.
Start with what's already installed
You don't need new panels or a rewiring project. The most efficient start: instrument the 3-5 largest consumers, usually air compressors, chillers, and the main line. That alone explains most of the bill. Additional points can follow once the pattern is clear.
If your panels have no communicating meters yet, add-on sensors can be installed without shutting the line down, with data transported by IncludeBox. For more complex needs (ERP integration, energy cost per production batch, or reporting to your internal standard) the INCLUDE services team can build it on the same platform.
The principle is simple: energy cost cannot be managed unless it is measured at a level you can actually control.
Want to know where your factory electricity cost goes?
Discuss your load profile and bill with the INCLUDE team, monitoring can start from the meters already in your panels.
Free consultation on WhatsApp → See InEnergy →