

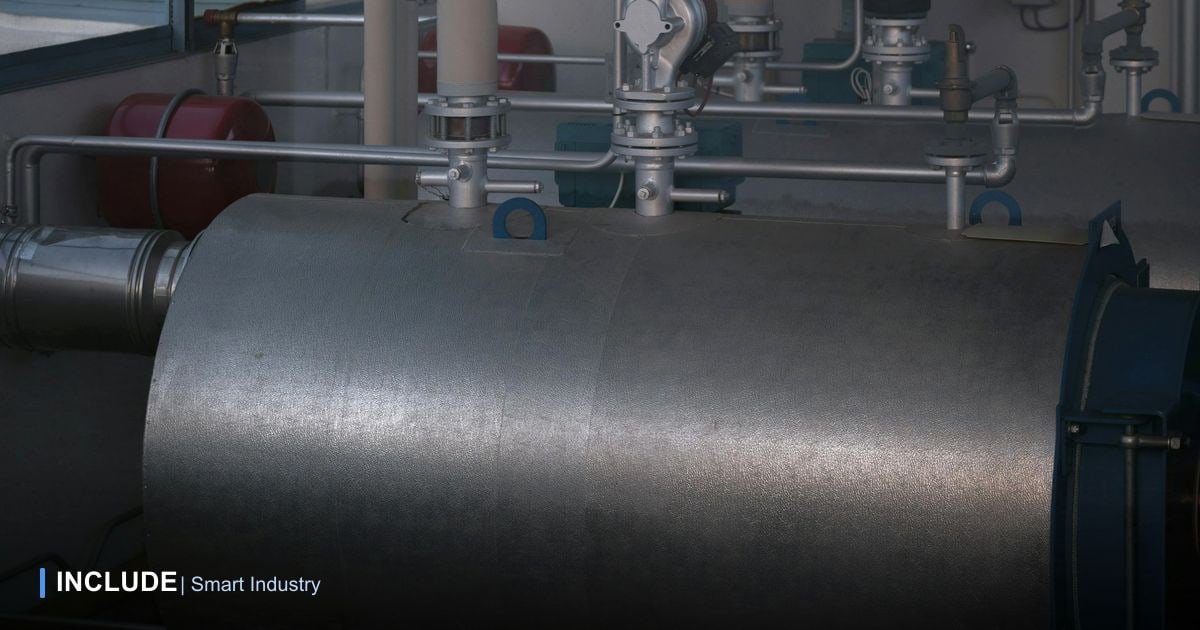
The boiler fuel bill keeps climbing while steam output feels the same. Operators log pressure and water level every hour, yet nobody can answer a simple question: how many kilograms of steam did each unit of fuel produce today, and is that worse than last month?
Boiler efficiency monitoring answers that question continuously. Efficiency is the share of fuel energy that ends up in the steam; the rest leaves through the stack, the boiler shell, and the water you drain. This guide covers the calculation, where heat is lost, what to measure, and what round-the-clock data reveals.
How to calculate boiler efficiency
- Direct method (input-output). Energy into steam (steam flow times the enthalpy rise from feedwater to steam) divided by fuel energy (fuel quantity times heating value). Simple, but it relies on trustworthy steam and fuel meters.
- Indirect method (heat loss). Each loss is calculated separately and efficiency is 100% minus their sum. It needs flue gas analysis and fuel data, and shows straight away which loss is largest.
As an illustration, a boiler makes 5,000 kg of saturated steam per hour at 8 barg with feedwater at 80 °C. Each kilogram carries about 2,440 kJ above the feedwater, so roughly 12.2 GJ per hour goes into the steam. If the fuel burned is worth 14.5 GJ per hour, efficiency is about 84%. Be clear whether you use gross (GCV) or net (NCV) heating value; the gap can be large, especially for natural gas.
Boiler heat losses: where the energy goes
| Loss | Usual cause | Data that reveals it |
|---|---|---|
| Dry flue gas | High stack temperature, too much air | Flue gas temperature and O2 |
| Moisture in flue gas | Hydrogen in the fuel, wet fuel | Fuel type and moisture |
| Incomplete combustion | Too little air, dirty or drifting burner | CO, unburnt carbon in ash |
| Surface radiation | Damaged insulation, long hours at low load | Surface temperature, load profile |
| Blowdown | Too much hot boiler water drained | Boiler water conductivity |
On most boilers the stack is the biggest loss. A rough rule of thumb for gas-fired boilers: efficiency rises about 1% for every 22 °C or so drop in stack temperature. Stack temperature cannot go too low, though, because acidic vapour can condense and corrode the stack; the lower limit depends on the fuel.
Leaking steam traps, bare pipework, and condensate sent to drain sit outside boiler efficiency but can matter as much. As with compressed air leaks, the energy is paid for at the source and lost on the way.
What to measure for boiler efficiency monitoring
| Parameter | Data source | What it tells you |
|---|---|---|
| Fuel | Gas or diesel meter; scales for coal and biomass | Energy in |
| Steam | Compensated steam flow meter, steam pressure | Energy out, demand profile |
| Feedwater | Flow and temperature after deaerator or economiser | Heat already recovered |
| Flue gas | Stack thermocouple, O2 analyser (ideally CO too) | Stack loss, excess air |
| Blowdown | Boiler water conductivity or TDS | Hot water sent to drain |
| Condensate | Returning flow and temperature, make-up water | Heat and water coming back |
| Burner status | Flame signal from the boiler controller | How often it cycles |
| Boiler house power | Power meters on pumps and fans | Electricity cost of steam |
Flue gas O2 is the most practical window on excess air: roughly O2 divided by (21 minus O2). As an illustration, 3% O2 means about 17% excess air, and 6% O2 about 40%. Excess air is heated and then thrown out of the stack. The right O2 target depends on fuel and burner, so use your tuning results, not a generic figure.
Patterns that continuous data reveals
An audit measurement shows one day. Data logged every minute shows change, and that is usually where the savings are:
- Stack temperature creeping up at the same load: soot on the fire side or scale on the water side. Cleaning can follow the data instead of the calendar.
- O2 rising above normal: air leaking into the furnace or burner settings drifting. O2 that is too low with rising CO means incomplete combustion.
- Steam-to-fuel ratio falling: the combined indicator management grasps most easily. Compare it at similar loads.
- Burner cycling on and off: every restart purges the furnace with air that carries heat out. It often shows at low load and can justify changing schedules or boiler sequencing.
- Excessive or inconsistent blowdown: conductivity well below the water treatment limit means hot water and chemicals are wasted. Differences between shifts stand out on a chart.
- Less condensate coming back: make-up rises and feedwater temperature drops, so more fuel goes into the same steam.
In the example above, moving from 84% to 85% cuts fuel by about 1.2% for the same steam. A boiler runs thousands of hours a year, so a small, steady gap becomes a real cost. Turning this into a report is covered in our article on factory energy audits.
Getting started
- List the instruments you already have. Many boiler controllers, flow meters, and O2 analysers already offer Modbus RTU, or a 4-20 mA output an analogue-to-Modbus module can read. See our guide to connecting Modbus RTU PLCs and meters to the cloud.
- Complete the fuel meter, steam meter, stack temperature, and O2. These four answer most efficiency questions.
- Build a baseline for each load band over a few weeks, then set alarms for deviations from it.
- Measure every fix, such as burner tuning or cleaning, with before and after data.
Things to keep in mind
- The direct method is only as good as its meters. A steam meter reading 2% high lifts calculated efficiency by about 2% in relative terms. Regular calibration is a must, O2 analysers included.
- Solid fuel heating values vary between suppliers and deliveries. Periodic lab tests make efficiency figures more reliable.
- Monitoring is not a safety system. Low-water cut-offs, safety valves, and flame safeguards must keep working on their own. In Indonesia, boiler operation also falls under steam boiler safety rules, including Minister of Manpower Regulation No. 4 of 2025 on Steam Boiler Operators, which sets operator qualifications and safety licences. Data supports operators; it does not replace them.
- Fitting sensors to pressure parts is a job for competent technicians following safety procedures.
Frequently asked questions
What is a good boiler efficiency?
It depends on boiler type, fuel, load, and heating value basis. The most useful benchmarks are your boiler maker's design data and the boiler's own history at the same load.
Do we need a steam flow meter?
Not to get started, since the indirect method works with flue gas and fuel data. Without one, though, you cannot see the steam-to-fuel ratio or the steam demand profile.
Does this work for coal and biomass boilers?
Yes, the principles are the same. The challenges are measuring the fuel, its changing heating value, and unburnt carbon in ash, which needs regular testing.
Monitoring boiler efficiency with INCLUDE
To be clear: InEnergy is built for electricity. In the boiler house it monitors voltage, current, power, energy, and power factor on feed pumps and fans, with cost per device and alarms.
The boiler data itself, such as fuel and steam flow, stack temperature, O2, and boiler water conductivity, reaches the same INCLUDE platform through IncludeGateways, which reads Modbus RTU controllers and instruments and sends the data over 4G or LoRa. Each parameter can have tiered safe ranges (optimal, warning, critical) and appears as a chart next to your electrical data. When a value leaves its range, an alarm appears and can be forwarded to Telegram. Derived figures such as the steam-to-fuel ratio can be set up with the INCLUDE team.
Boiler fuel costs rising for no clear reason?
Tell us about your boiler type, fuel, and the instruments already installed. The INCLUDE team will help decide which data to read first.
Free consultation on WhatsApp → See InEnergy →