

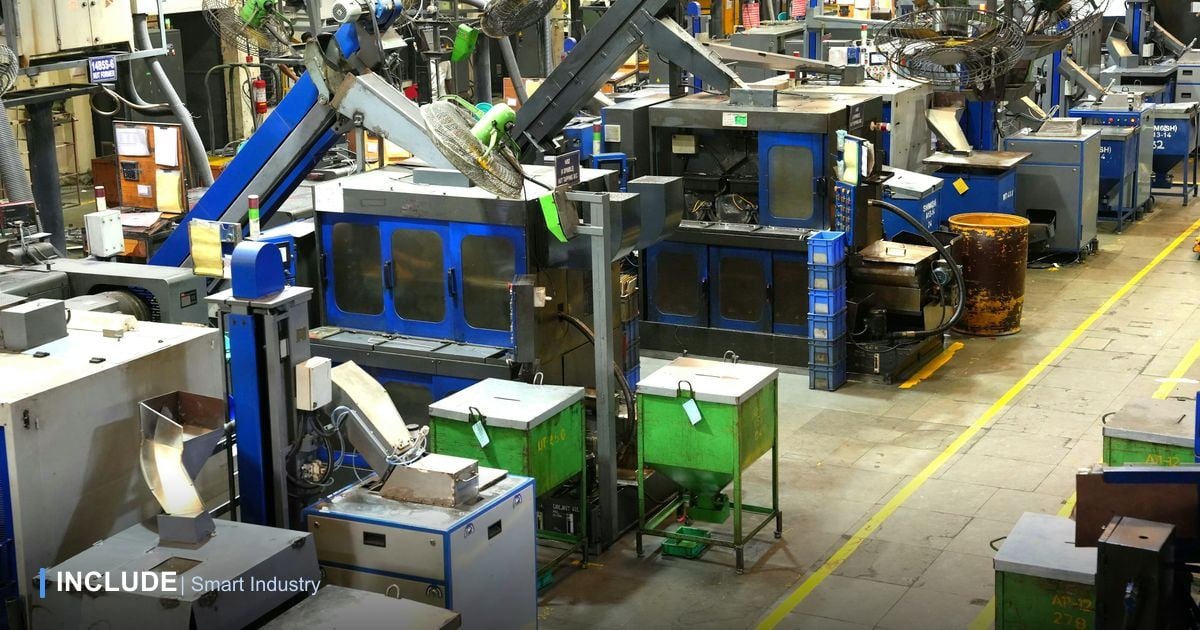
The machine at station three stops. The operator raises a hand, waits for the team leader to walk past, and the team leader goes looking for a technician. Fifteen minutes later the machine is running again, but nobody has recorded how long the line waited or why. Tomorrow it happens again, and the target board at the end of the line only gets updated at break time.
A digital andon changes that. The status of every station appears on a screen visible from the shop floor, fed straight from machine data and operator call buttons. Calls nobody answers move up to the next person, and every event is logged. This guide covers what to display, how to set up escalation, and which data is worth keeping.
What a digital andon is
Andon comes from the Japanese word for lantern. In manufacturing it means a visual signal telling everyone that a station needs help. The original version was a stack light on the machine and a cord or button the operator pulled when something went wrong. A digital andon adds three things:
- Automatic data. Running or stopped status comes from the machine, not from an operator remembering to press a button.
- A shared board. Every station's status appears on one screen on the floor, in the supervisor's office, and on phones.
- Records and escalation. Each call has a time raised, time answered, and time resolved, and calls that wait too long move up a level.
Where the data comes from
- PLC status. Many PLCs already expose run, stop, fault, or setup bits that can be read.
- Electrical current. For older machines without a readable PLC, main motor current shows whether the machine is running, idling, or off.
- Part counts. A PLC counter or a sensor at the end of the station gives actual output per hour.
- Call buttons. One button per call type, such as maintenance, quality, and material, wired to a digital input module. A physical button is easier to hit than a touchscreen when the operator's hands are full.
- Production schedule. Breaks, planned changeovers, and hourly targets, so planned stops do not show up as problems.
What to show on an andon board
An andon board is read at a glance from several metres away, so keep it short and clear. A common colour scheme, to adapt to whatever your plant agrees on:
| Colour | Meaning | Example trigger |
|---|---|---|
| Green | Running normally | Run status, output on target |
| Yellow | Needs attention | An active call, or output behind this hour's target |
| Red | Unplanned stop | Machine fault or a stop past the time limit |
| Blue or grey | Planned stop | Break, changeover, scheduled maintenance |
A useful board also shows:
- Target versus actual per hour and for the shift so far, so a shortfall is visible before the shift ends.
- How long the current stop has lasted. A two-minute stop and a twenty-minute stop need different responses.
- Active calls with type, station, and waiting time.
Long trend charts, OEE breakdowns, and tables full of numbers belong on the supervisor's dashboard. Designing views by role is covered in our article on IoT dashboards for factory operations.
Escalation: who gets called, and when
The point of an andon is the response, not the light. A call nobody answers has to move up to someone with more authority. The table below is only an illustration; agree the time limits with production and maintenance:
| Level | When | Who |
|---|---|---|
| 1 | When the call is raised | Line team leader, via the board and a notification |
| 2 | Not answered after 5 minutes | Shift supervisor and on-duty technician |
| 3 | Line still down after 20 minutes | Production or maintenance manager |
Escalation works when whoever arrives marks the call as acknowledged, and each level only receives the calls it needs to act on. If everyone gets every call, notifications are soon ignored. Our guide to setting sensor alarm thresholds explains how to avoid that.
Andon data after the shift
After a few weeks, call records answer questions that used to get guesses:
- Response time: from call to someone arriving, by shift and call type.
- Resolution time: from arrival to the line running again.
- Call Pareto: which stations and reasons call most often.
- Timing patterns: material calls bunching at certain hours, for example, often point to the warehouse delivery schedule rather than the operators.
The same data feeds the availability part of OEE. The andon handles problems as they happen; OEE measures their effect on capacity. Reading OEE in real time is covered in our article on real-time OEE monitoring.
Rolling out an andon system
- Start with one line, the one that stops most often or limits output most.
- Agree on statuses and call types. Three or four call types are usually enough at first.
- Map machine signals for each station, then check that the screen matches what is really happening.
- Design the board and escalation matrix with team leaders, not just with IT.
- Train operators and responders. Operators must feel safe asking for help, and responders must know how to acknowledge a call.
- Review the data weekly and adjust time limits, call types, and layout.
Things to keep in mind
- An andon depends on a culture of response. If calls are left hanging, operators stop using it and the board becomes decoration.
- Separate planned and unplanned stops. Without the production schedule, breaks and changeovers show red and erode trust in the board.
- A digital andon is not a safety system. Emergency stops, interlocks, and machine guards must keep working on separate circuits that do not depend on the network or a platform.
- Keep a local signal. Stack lights on machines are still useful, so the floor is not blind when the screen loses data.
Frequently asked questions
How is a digital andon different from a stack light?
A stack light is only visible near the machine and records nothing. A digital andon shows every station on one screen, routes calls to the right people, and keeps a history of every event. Stack lights remain useful as a local signal.
Can older machines be included?
Yes. If the PLC cannot be read, running and stopped status can come from motor current or a simple sensor, and call buttons can be added separately.
Do we need a special screen?
Not necessarily. A web-based andon board can run in a browser on a monitor or TV on the shop floor, and the same view opens on a supervisor's phone.
Digital andon with INCLUDE
On the INCLUDE platform, machine status, part counts, and call buttons arrive over MQTT or HTTP, or are read from PLCs and Modbus RTU input modules through IncludeGateways. Data is pushed to the dashboard as it arrives, with no page refresh, so the board on the floor moves with what happens on the line.
You build the board yourself from 88 widgets, such as status and value cards, charts, history tables, and alarm tables, and open it on a floor screen or in the mobile app with the same layout. Each parameter can have optimal, warning, and critical thresholds; if the PLC exposes stop duration as a register, those thresholds become time-based escalation. Alarms can be acknowledged and resolved, and notifications go out by app, email, or Telegram depending on your plan. More complex logic can be built with Rule Chain, which supports JavaScript nodes (Pro plan and above), and automation rules can send commands to actuators, such as a relay that switches on a stack light.
Lines stopping with no clear record of why?
Tell us how many stations you run, the machine types, and the PLCs in use. The INCLUDE team will help map the signals for your first andon board.
Free consultation on WhatsApp → See the INCLUDE platform →