

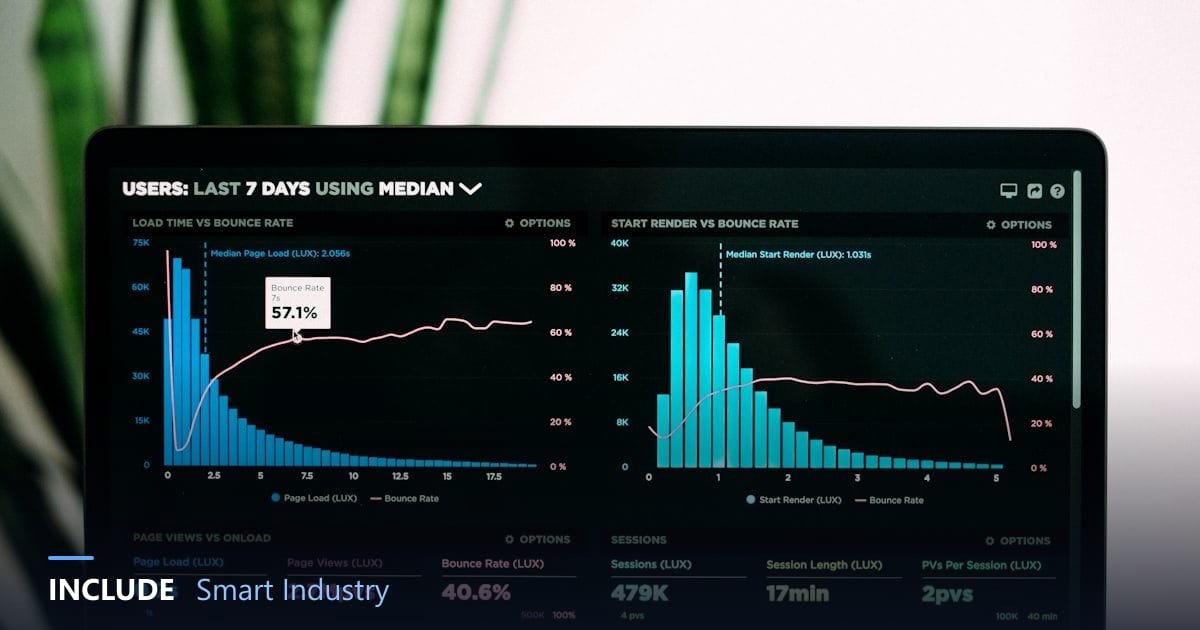
Collecting data from machines is only half the job. Its value appears when the data is presented in a way that lets people act. Many IoT projects stall not because sensors fail, but because the dashboard is full of numbers, charts nobody understands, and answers to questions nobody asked.
This article covers what a factory operations IoT dashboard needs, how to build it for different users, and when a ready-made dashboard should be extended with custom development.
Start from questions, not data
A good dashboard starts from the questions its users want answered. An operator asks "which machine has a problem right now?". A supervisor asks "which line is behind today's target?". A manager asks "how is energy cost per unit trending this month?". One dashboard trying to answer all of these at once usually answers none of them well.
What it needs
- A current status summary. The state of every important asset on one screen, with consistent colours for normal, attention, and danger.
- Meaningful metrics. Not just raw numbers, but metrics tied to decisions, such as energy per unit, downtime, or a machine health score.
- Historical trends. A single momentary value is rarely enough. Daily and weekly trends show whether things are improving or getting worse.
- Clear alarms. A list of active alarms with severity and who is handling them.
- Role-based access. Operators, supervisors, and management each see what fits their needs.
Principles for readable screens
- Most important at top left. That is where the eye reads first.
- One chart, one message. A chart with too many lines is hard to read at a glance.
- Colour only for meaning. Red is for problems, not decoration. If everything is coloured, nothing stands out.
- Always show units. A bare 45 could be a temperature, a percentage, or amperes.
- Readable from a distance for screens on the production floor, with large numbers and minimal text.
A dashboard for each role
Operators need the status of machines in their area and alarms that need immediate action. Supervisors need line-to-line comparison, progress against target, and why machines stopped. Management needs weekly and monthly summaries, cost trends, and site-to-site comparison. All three views can come from the same data, just arranged differently.
Ready-made or custom
For common needs, such as energy or machine condition monitoring, a ready-made dashboard answers most questions and works straight away. A dashboard needs tailoring or a custom build when:
- Your process is unique and needs special calculations.
- Data comes from many sources that must be combined, such as sensors, PLCs, and ERP.
- There is specific business logic, such as per-shift targets or approval rules.
- Screens must follow internal company standards.
A good platform allows both: start from a ready-made template, then add custom widgets without rebuilding from scratch.
Common mistakes
- Showing all available data just because it exists.
- Not involving users when designing screens, so the dashboard goes unused.
- Never reviewing it. Needs change, and dashboards must change with them.
An example production line layout
- Top row: status of every machine on the line (running, stopped, alarm) and progress against today's target.
- Middle row: hourly output and the top stop reasons this week.
- Bottom row: line energy use and energy per unit, compared with last week.
- Side panel: active alarms with the name of the person responsible.
This layout answers a supervisor's three questions on one screen: what is happening, whether the target is on track, and what to handle first.
Dashboards for shop-floor screens
Large screens on the production floor have their own rules. Show a few numbers in large type, use status colours visible from a distance, and avoid long tables. The goal is for everyone on the line to know the current state at a glance, without walking up to the screen.
Frequently asked questions
How many widgets should one dashboard have?
There is no fixed number. The rule: every widget must answer a question its users actually ask.
Can dashboards be viewed on a phone?
Yes, if the platform supports web and mobile. Phone views should be more compact.
When do we need a custom dashboard?
When the process is unique, data from many sources must be combined, or business logic falls outside ready-made templates.
Dashboards on the INCLUDE platform
The INCLUDE platform provides ready-made dashboards for every solution, which can be rearranged by drag-and-drop from dozens of widgets. For special needs, widgets can be written in JavaScript, or developed with the INCLUDE services team. Business system integration is covered in integrating IoT data with ERP, and alarm setup in sensor alarm thresholds.
Is your current dashboard going unused?
Tell us who the users are and which decisions you want to support. The INCLUDE team will help design the screens.
Free consultation on WhatsApp → See the INCLUDE platform →